3D Gradient Descent
Machine Learning Theory
Visualization
React
Plotly
JavaScript
CSS
web
A React web app that visualizes gradient descent in 3D.
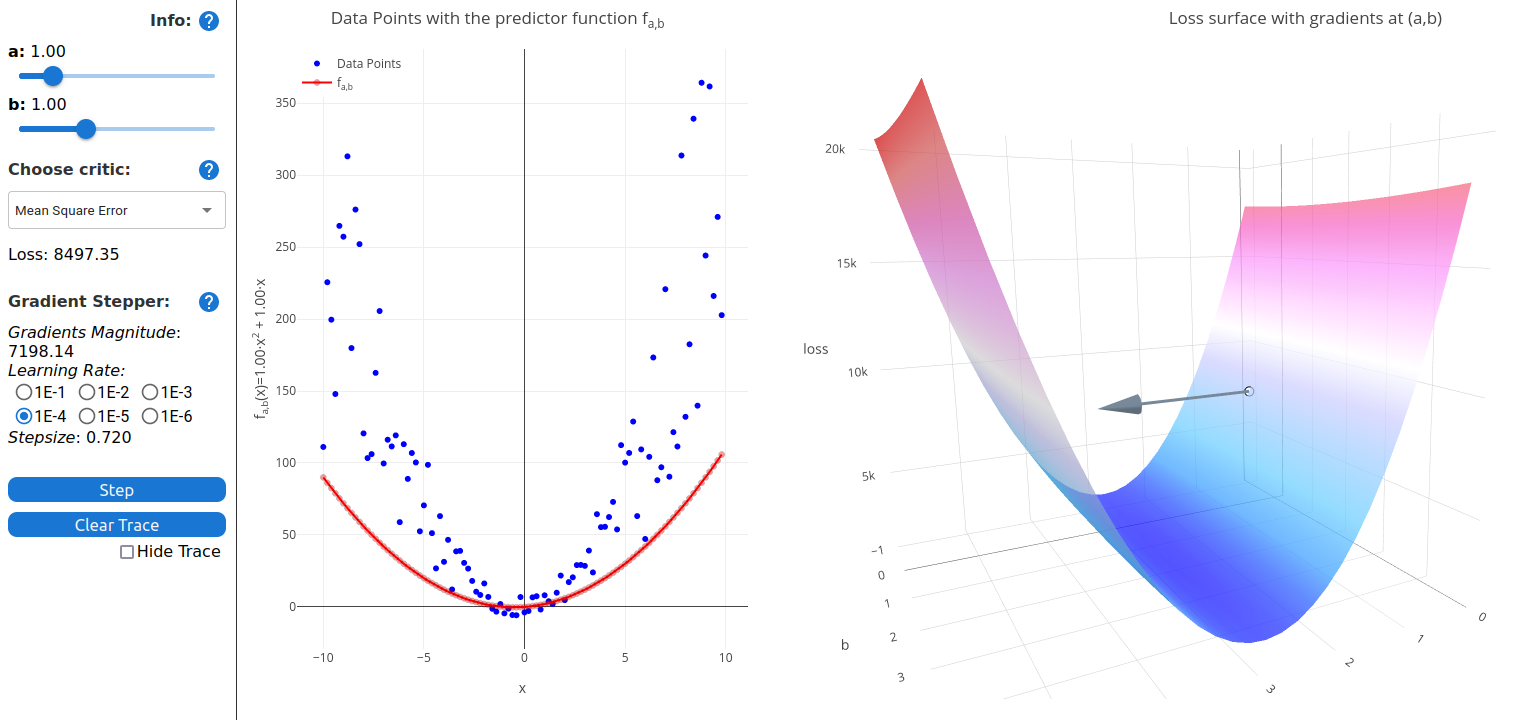
With this app you can:
- manually fit a quadratic function to some data,
- use a Stepper to automatically step the parameters towards the local minimum,
- have a look at the trace the loss left as it walked through the loss surface,
- choose from different critics (
mae,mse,rmse) to “see” how changing the way we measure the loss effects gradient descent, - intuitively interact with the 3D-plot by dragging and zoom, to keep the interesting parts in focus.